Electron Spin Resonance
Electron Spin Resonance (ESR) Project
Electron Spin Resonance is a phenomenon, useful for the investigation of materials which contain unpaired spins. Those are caused by various sources. One are not completely filled atomic shells, however, the more interesting ESR signals arise from different circumstances combined in the term defect. For instance, a important one is impurities of semiconductors or isolators which can trap electron or holes. Therefore this measuring technique is very powerful evaluation of material properties and is used in lots of research fields in physics, chemistry and biology.
Physical background
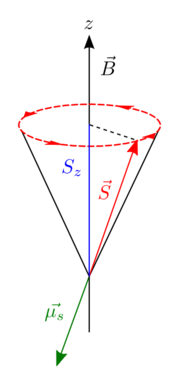
As the term Electron Spin Resonance already implies, the most essential part of the entire topic is the Spin, an intrinsic angular momentum of the electron. In an atom most of the electron are paired regarding spin. That is, each electron has a partner with an opposite spin, creating a zero net spin. Depending on the electron configuration of an atom or one step above in molecules and solids respectively, it is possible that there are a few or even many single electrons, being up to material.
Generally the magnetic moment of an electron is given by
Failed to parse (SVG (MathML can be enabled via browser plugin): Invalid response ("Math extension cannot connect to Restbase.") from server "https://wikimedia.org/api/rest_v1/":): {\displaystyle \vec{\mu}=-\mu_B\left(\vec{L}+g_e\,\vec{S}\right) } ,
where Failed to parse (SVG (MathML can be enabled via browser plugin): Invalid response ("Math extension cannot connect to Restbase.") from server "https://wikimedia.org/api/rest_v1/":): {\displaystyle \mu_B } is the Bohr's magneton and Failed to parse (SVG (MathML can be enabled via browser plugin): Invalid response ("Math extension cannot connect to Restbase.") from server "https://wikimedia.org/api/rest_v1/":): {\displaystyle g_e } the magnetogyric ratio, for a free electron it is Failed to parse (SVG (MathML can be enabled via browser plugin): Invalid response ("Math extension cannot connect to Restbase.") from server "https://wikimedia.org/api/rest_v1/":): {\displaystyle g_e=2.0023\approx 2 } . This quantity is a measure for the quantitative relation of an angular momentum and its corresponding magnetic momentum. The latter formula includes the orbital angular momentum as well. With ESR it is only possible to detect and investigate the spin component of the total magnetic moment. Hence, in the further deviation we will look at the pure magnetic moment originating from the spin Failed to parse (SVG (MathML can be enabled via browser plugin): Invalid response ("Math extension cannot connect to Restbase.") from server "https://wikimedia.org/api/rest_v1/":): {\displaystyle \vec{S} } .
If the spin Failed to parse (SVG (MathML can be enabled via browser plugin): Invalid response ("Math extension cannot connect to Restbase.") from server "https://wikimedia.org/api/rest_v1/":): {\displaystyle \vec{S} } and its magnetic moment Failed to parse (SVG (MathML can be enabled via browser plugin): Invalid response ("Math extension cannot connect to Restbase.") from server "https://wikimedia.org/api/rest_v1/":): {\displaystyle \vec{\mu_S} } is placed in a externally applied magnetic field, the magnetic moment of the spin starts to precess around the axis of the magnetic field due to the torque
Failed to parse (SVG (MathML can be enabled via browser plugin): Invalid response ("Math extension cannot connect to Restbase.") from server "https://wikimedia.org/api/rest_v1/":): {\displaystyle \vec{M}=\vec{\mu_S}\times\vec{B_Z} } .
As always in Quantum Physics the chosen axis of the magnetic field points in Failed to parse (SVG (MathML can be enabled via browser plugin): Invalid response ("Math extension cannot connect to Restbase.") from server "https://wikimedia.org/api/rest_v1/":): {\displaystyle z } direction.
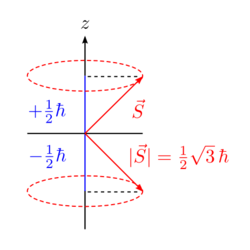
In general, the energy Failed to parse (SVG (MathML can be enabled via browser plugin): Invalid response ("Math extension cannot connect to Restbase.") from server "https://wikimedia.org/api/rest_v1/":): {\displaystyle E } of a magnetic moment Failed to parse (SVG (MathML can be enabled via browser plugin): Invalid response ("Math extension cannot connect to Restbase.") from server "https://wikimedia.org/api/rest_v1/":): {\displaystyle \vec{\mu} } is defined as
Failed to parse (SVG (MathML can be enabled via browser plugin): Invalid response ("Math extension cannot connect to Restbase.") from server "https://wikimedia.org/api/rest_v1/":): {\displaystyle E=-\vec{\mu}\cdot\vec{B_Z} } .
The magnetic moment Failed to parse (SVG (MathML can be enabled via browser plugin): Invalid response ("Math extension cannot connect to Restbase.") from server "https://wikimedia.org/api/rest_v1/":): {\displaystyle \vec{\mu} } is related to the spin Failed to parse (SVG (MathML can be enabled via browser plugin): Invalid response ("Math extension cannot connect to Restbase.") from server "https://wikimedia.org/api/rest_v1/":): {\displaystyle \vec{S} } , which is a so called Quantum Vector with special properties:
- Absolute value: Failed to parse (SVG (MathML can be enabled via browser plugin): Invalid response ("Math extension cannot connect to Restbase.") from server "https://wikimedia.org/api/rest_v1/":): {\displaystyle |S|=\sqrt{s\left(s+1\right)} }
- Projection onto the z-axis: Failed to parse (SVG (MathML can be enabled via browser plugin): Invalid response ("Math extension cannot connect to Restbase.") from server "https://wikimedia.org/api/rest_v1/":): {\displaystyle m_S=\pm\frac{\hbar}{2} }
Incidentally, those two quantities are the best way to distinguish the state of the electron, because only their operator commute and hence, are measurable at the same time. For instance, it is not possible to measure two of the three Cartesian components of the spin vector simultaneously.

The equation for the energy of the electron's spin in an applied magnetic field contains a dot product between the magnetic moment and the B-field:
Failed to parse (SVG (MathML can be enabled via browser plugin): Invalid response ("Math extension cannot connect to Restbase.") from server "https://wikimedia.org/api/rest_v1/":): {\displaystyle E=\mu_B\,g_e\,\vec{S}\cdot\vec{B_Z} }
It may seem to complicate the situation, but actually it simplifies it a lot. We have chosen our magnetic field to point into the Failed to parse (SVG (MathML can be enabled via browser plugin): Invalid response ("Math extension cannot connect to Restbase.") from server "https://wikimedia.org/api/rest_v1/":): {\displaystyle z } direction. Since the spin is characterized by the projection onto the Failed to parse (SVG (MathML can be enabled via browser plugin): Invalid response ("Math extension cannot connect to Restbase.") from server "https://wikimedia.org/api/rest_v1/":): {\displaystyle z } axis, depicted by the Quantum number Failed to parse (SVG (MathML can be enabled via browser plugin): Invalid response ("Math extension cannot connect to Restbase.") from server "https://wikimedia.org/api/rest_v1/":): {\displaystyle m_S } , the dot product cancels to
Failed to parse (SVG (MathML can be enabled via browser plugin): Invalid response ("Math extension cannot connect to Restbase.") from server "https://wikimedia.org/api/rest_v1/":): {\displaystyle E=\mu_B\,g_e\,m_S\,B_Z }
with
Failed to parse (SVG (MathML can be enabled via browser plugin): Invalid response ("Math extension cannot connect to Restbase.") from server "https://wikimedia.org/api/rest_v1/":): {\displaystyle m_S=\pm\frac{\hbar}{2} } .
Bohr's magneton Failed to parse (SVG (MathML can be enabled via browser plugin): Invalid response ("Math extension cannot connect to Restbase.") from server "https://wikimedia.org/api/rest_v1/":): {\displaystyle \mu_B } and the magnetogyric ratio Failed to parse (SVG (MathML can be enabled via browser plugin): Invalid response ("Math extension cannot connect to Restbase.") from server "https://wikimedia.org/api/rest_v1/":): {\displaystyle g_e } are both natural constants at this point. If a external magnetic field Failed to parse (SVG (MathML can be enabled via browser plugin): Invalid response ("Math extension cannot connect to Restbase.") from server "https://wikimedia.org/api/rest_v1/":): {\displaystyle B_Z } is applied (positive value, because we picked the Failed to parse (SVG (MathML can be enabled via browser plugin): Invalid response ("Math extension cannot connect to Restbase.") from server "https://wikimedia.org/api/rest_v1/":): {\displaystyle z } orientation of our coordinate system in such a way), the electron's energy is reduced or raised, depending whether Failed to parse (SVG (MathML can be enabled via browser plugin): Invalid response ("Math extension cannot connect to Restbase.") from server "https://wikimedia.org/api/rest_v1/":): {\displaystyle m_S } is negative or positive, respectively. The original single energy state, which we still get out of the equation for Failed to parse (SVG (MathML can be enabled via browser plugin): Invalid response ("Math extension cannot connect to Restbase.") from server "https://wikimedia.org/api/rest_v1/":): {\displaystyle B_Z=0 } , is split into two different energy states. Moreover, the energy difference
Failed to parse (SVG (MathML can be enabled via browser plugin): Invalid response ("Math extension cannot connect to Restbase.") from server "https://wikimedia.org/api/rest_v1/":): {\displaystyle \Delta E=E_{+1/2}-E_{-1/2}=+\frac{1}{2}\,\mu_B\,g_e\,B_Z-(-\frac{1}{2}\,\mu_B\,g_e\,B_Z)=\mu_B\,g_e\,B_Z}
is proportional to the strength of the applied magnetic field. Therefore that difference can be tuned very precisely by the experimental setup, which is very important for the latter detection of the ESR signal.
For typical laboratory B-fields the energy difference Failed to parse (SVG (MathML can be enabled via browser plugin): Invalid response ("Math extension cannot connect to Restbase.") from server "https://wikimedia.org/api/rest_v1/":): {\displaystyle \Delta E } ranges in the microwave photon band, if you convert the energy to wavelength or rather frequency. This is the point, where the name of the entire phenomenon originates. Namely, if one irradiates the unpaired spin, which normally sits in the lower energy state (due to general energy minimization of nature), with the correct frequency, the energy gets absorbed, combined with a transition to the upper level. In this case, the energy of the photons match exactly the energy difference between both states. Physicist call this situation Electron Spin Resonance.
In formula language the following becomes true:
Failed to parse (SVG (MathML can be enabled via browser plugin): Invalid response ("Math extension cannot connect to Restbase.") from server "https://wikimedia.org/api/rest_v1/":): {\displaystyle h\,\nu=\mu_B\,g_e\,B_Z } ,
where Failed to parse (SVG (MathML can be enabled via browser plugin): Invalid response ("Math extension cannot connect to Restbase.") from server "https://wikimedia.org/api/rest_v1/":): {\displaystyle h } is Planck's constant and Failed to parse (SVG (MathML can be enabled via browser plugin): Invalid response ("Math extension cannot connect to Restbase.") from server "https://wikimedia.org/api/rest_v1/":): {\displaystyle \nu } the frequency of the incident light.
Other than the magnetogyric ratio Failed to parse (SVG (MathML can be enabled via browser plugin): Invalid response ("Math extension cannot connect to Restbase.") from server "https://wikimedia.org/api/rest_v1/":): {\displaystyle g_e } are all quantities either natural constants or measured values. Above I claimed that this value is a natural constant, too. Well, technically it is one, however, depends on the material and its compounds and especially spin stucture. Taking the previous equation as well as transferring it to an expression for the magnetogyric ratio
Failed to parse (SVG (MathML can be enabled via browser plugin): Invalid response ("Math extension cannot connect to Restbase.") from server "https://wikimedia.org/api/rest_v1/":): {\displaystyle g_e=\frac{h\,\nu}{\mu_B\,B_Z} }
yields material properties with regard to the spin configuration. For example, the comparison to the definite value of a free electron is an good indicator for various substances' features.
Experimental setup
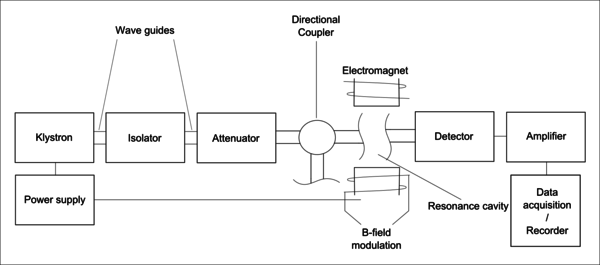
An ESR setup can vary by its looks and equipment used, but there are many common elements between them. A microwave source is incident to a sample within a resonance cavity, which is flanked by magnets perpendicular to the light source. Our setup housed these elements in two separate machines - a main console, and a magnet bridge.
Theoretical setup
The magnet bridge is where the resonance happens, and as a result is the most important machine of the two. It houses the electromagnets, klystron, and allows control of the frequency of light and attenuation of that light. The microwave source is generated by a klystron, which passes the light through waveguides, to various parts of the system. A simple diagram is shown, with a more detailed view shown in the [desired and future ESR setup] section. The connection to the main console is omitted in the diagram, as its intended to be eliminated from the system eventually. For now, the main console serves a handful of purposes.
The main console is responsible to set the magnetic field and magnetic sweep range and time, along with demodulating the signal from the magnet bridge. The demodulator on this console allows setting a time constant for the demodulation, along with a post-amplifier for the signal. At one point in time, it allowed use of an XY-recorder, but that function has since been removed.
Actual setup
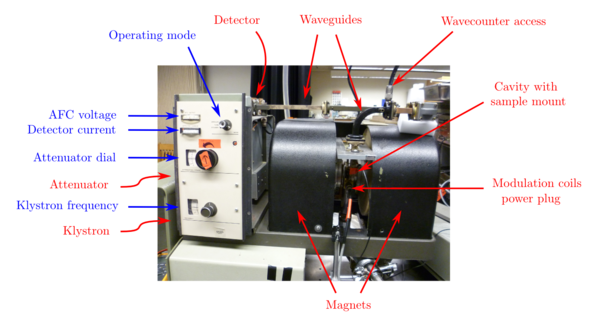
Knowing the theoretical assembly, it is much easier to understand the actual machine with its numerous devices, knobs and dials. the following pictures depict the ESR system that is available in the Advanced Project Laboratory.
Magnet bridge
This table will explain the function of each part.
| Function of all experimental parts | |||||
|---|---|---|---|---|---|
| Klystron | |||||
| Attenuator | |||||
| Frequency dial | |||||
| Detector current | |||||
| AFC voltage | |||||
| Modulation coils | |||||
| Iris | |||||
Main console
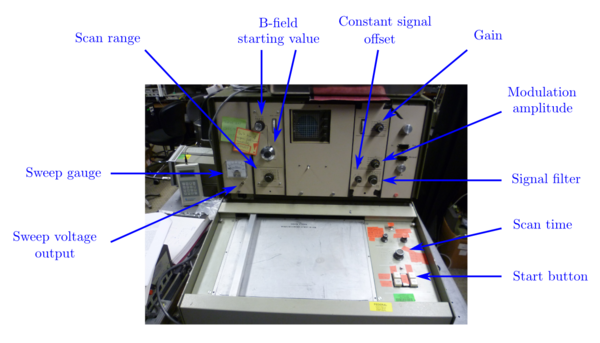
For concrete illustration of the main control panel review this table.
| Function of all experimental parts | |||||
|---|---|---|---|---|---|
| Main B-field - DC B-field | blablabla | ||||
| Gain | |||||
| Modulation coils - AC B-field | |||||
| Signal filter | |||||
| Pen level | |||||
| Side scan panel | |||||
Miscellaneous other useful information about the various parts
Helpful and beneficial information about all the different and numerous components:
<NOTES, other than the obvious function>
| Various components of the magnet bridge | |||||
|---|---|---|---|---|---|
| Klystron | need to be cooled as well, turn on water cooling system even when magnet are powered off, but klystron is used | ||||
| Attenuator | verified to function properly: nicely expononetiell dependence | ||||
| Frequency dial | |||||
| Detector current | does not go to zero, but minimum is about 40 | ||||
| AFC voltage | works only in vicinity of the resonance, otherwise crazy | ||||
| Modulation coils | Power reqired tested with DC power supply: 40G with approximately 2 A at 5 V, but already really hot | ||||
| Iris | cannot be closed entirely, however, cannot strewed in further at one point, also by using a screwdriver, defined closed as the slit being parallel to the magnet gap, at the point one feels quite a amount of friction, using a screwdriver | ||||
| Miscellaneous | does not function without the main console switched on, even though it gets power from the wall outlet, since the main power cable going into the main control panel is split into two circuits, one into the main console and the other one directly into the magnet bridge without any "door"; In generall looking good with respect to reliability and functionality | ||||
| Function of devices of main control panel | |||||
|---|---|---|---|---|---|
| B-field | unit Gauss, must be turned slowly, applies DC current through side prongs, aside from the top one, of cable on the buttom right corner of the back | ||||
| Gain | not sure whether it works alright, maybe facilitating drift as well | ||||
| Modulation amplitute | seems that great set values enhance signal drift | ||||
| Signal filter | there are more knob position than number written around it, althoug, the numbers might be the time of a low pass filter | ||||
| Pen level | seems to drift slowly, depending on the Gain value up or down | ||||
| Side scan panel | sweep actually is driven mechanically trough the old data plotting pen type a thing on the horizontal panel, there is a mechanism below that board | ||||
| Miscellaneous | main switch enables magnet bridge as well;
main power cable at the buttom right corner on the back: top: ground, aside from the top: + and - electrode (going through fuses and the get split into two, connecting to the main console and the magnet brigde without any "door", two lower prongs are connected (low resistance) on either sides (main console and magnetbridge), simply a mystery; | ||||
Operating instructions
Operating the ESR setup is relatively simple, as long as you obey the following steps. However, there are some essential things to do and a few things not to do, respectively. Comply with this guidelines:
Starting the machine
- Turn on the water cooling system to a decent flow rate. It is not necessary open the outlet lever entirely. In fact, that will cause quite a high pressure in the supply hose, perhaps leading to subtle damage. Moreover, longruns have shown that the outflow does not get warmer at all, even after hours at a quite high magnetic field strength.
- Check else is shut down:
- Switch at the back of the magnet bridge, which hosts the klystron and the detector.
- Mode switch on the front panel is set to standby.
- Magnetic field set value is zero.
- Enable power switch on the lower left corner of the main console.
- Clean your sample and place it inside the tube, made for holding the sample between the two magnet poles.
- Change mode first to turn and then to operate. Wait for a while (up to one minute). Dial the frequency once in a while and see whether the two scales AFC output and detector current respond. When they react to changes, set the AFC to zero. The frequency of the klystron equates the resonance frequency of the cavity now.
- Adjust the Iris height by screwing the stick in or rather out. The aim is to minimize the detector current which correspond to the total power of reflected microwaves (The past has shown that the height ranges at approximately 3-4 rotations from closed entirely).
- Align the height of the sample inside the tube. The sample is sitting in the center of cavity and hence has an effect on the resonance frequency of the cavity. For the measurement later on, it is very desirable to reduce it to a minimum. The sample pipe is put into the holder tube by a little ring, which prevents it from falling into the tube. Carefully change the position of the ring and always put the sample pipe back and see where the AFC stops. You want the AFC to be as left as possible. This step is really sensitive. Normally the AFC changes just by pulling the sample pipe out and inserting it back, without sliding the ring. Even rotating the sample interacts with the AFC, especially when the material is not distributed uniformly at the very bottom of the pipe. That is the case for materials other than liquids and powders, for instance little solid plates.
- Check the Iris again (optional)
- Chose a value for Gain: Too low leads to inability to distinguish whether whether there is a signal or not; Too high values correlate tot a lot of crazy noise; Good starting value: 100 - 1000
- Chose your Modulation Amplitude: Too small choice will not excite any transitions; Too great values are related to unnecessary broadening of the absorption wiggle, for better resolution this area should be as narrow as possible; Good starting value: 1 - 4
- Set the Signal Filter: Too little choices will let a lot of useless signal pass; Too high values will lead to a cut-off of the desired signal; Good starting value: position 4 - 10
- Select your Scan Time: Longer enhances resolution later on and too short disable the opportunity to detect the transition (however, it depend also on the magnetic field scan range); But longer is not always good, especially when your setup shows a drift in any of the other components: Good starting value: 1 minute
- Set the magnetic field start value and the sweep interval.
- Press the start knob on the horizontal board of the main console, right to the old data plotting mechanism.
Changing sample
- You may shut down the magnetic field first.
- Switch the mode from operate to tune (on the magnet bridge).
- Replace the sample. Do not forget to clean it.
- Repeat steps 5 to 11 of the list above.
Shutting down
- Power off the magnetic field.
- Switch the mode from operate to tune (on the magnet bridge). Afterwards spin the know even more to standby mode.
- Take your sample out of the cavity and store or shelf it.
- Disable magnet bridge by switch at the back.
- Press main power switch on the main control panel.
- Close water supply.
ESR measurements
We have a bunch of samples, which are supposed to be responsive to ESR. Unfortunately none of them, except two, are labeled or named. In the entire process of working on this project we tested numerous samples of this set. Most of them did not show any signal within the whole magnetic field scan range, however, at this point our skills on at which dial to chose which value was really limited. We tried to tune and optimize the quantities though, and dedicated quite a lot of time to consistency and the attempt to repeat ESR spectra with different materials.
DPPH
The strongest signal shows DPPH, the organic chemical compound 2,2-diphenyl-1-picrylhydrazyl. The absorbance of the incident microwave irradiation is really strong, such that the various parameters of the entire experiment loose their importance. As long as reasonable values for the numerous setting are chosen, one can find the strength of the magnetic field, where the dip in the by the cavity reflected power occurs - even when the magnetic field gets scanned kind of fast. Therefore, it's the perfect sample for the beginning and for ESR learners, because you receive a response for regulations far off the optimum. Moreover, always when something is changed at the experimental setup and it seems that it does not work appropriately any more, it is the sample to verify any issues, misalignment and damage.
One of our nicest DPPH spectrum is shown below. The figure depicts the linear sweep of the magnetic field strength as well, related to the sweep voltage:
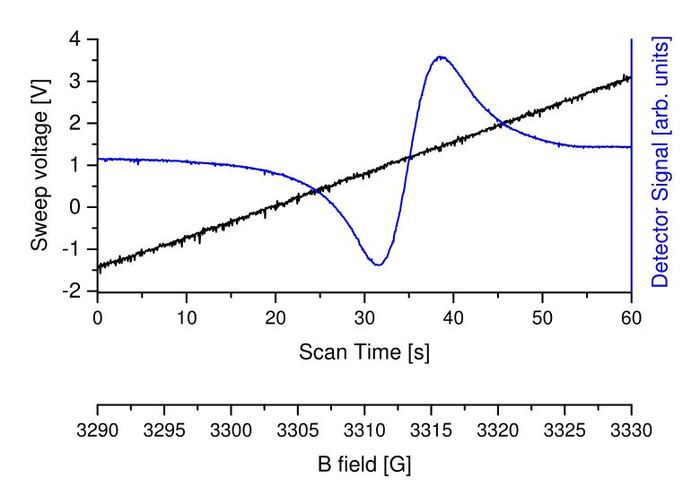
This spectrum is taken with the original main console as central controlling panel (future plans are to bypass this entire part) and the digital oscilloscope on the laptop, using the data acquisition board from Measurement Computing. The concrete set values were
- Frequency (exterior wavecounter): 9.2437 GHz
- Attenuation: 20 dB
- Iris (rotation from closed completely): 3.75
- B field start: 3290 G
- B field delta: 40 G
- Scan time: 1 min
- Signal filter: position 7
- Modulation amplitude: 4 G
- Gain: 1000
The characteristic wiggle crosses the imaginary baseline (constant offset of all data points) at 3313.6 G. Given that result, the magnetogyric ratio would be 1.99, which deviates by a lot from the set value of approximately 2.0036. Although, the measuring error is really hugh, considering various sources like the slow frequency drift, correctness of the B-field set point, ... among others.
Incidentally, the sweep voltage is very important to find the actual start and end point of the sweep at this stage, because it is directly coupled to the mechanical sweep mechanism. One can use the trigger, but there is still a delay between the impulse and the real start of cycle.
ZnS (Sample #8)
In fact this sample not only contains inorganic ZnS (zinc sulfide), but it form a layer on a Silicon wafer. Since Silicon forms a perfect lattice, in theory, all that is observed ESR respond should originate from the ZnS coat. Though, everybody knows that practically there are no perfect crystals in nature. Hence, it is possible that signals arise as well from impurities in the Silicon lattice.
In fact, the exact magnetic field strength of this sample, we found by first looking up, where it should appear approximately. It is much weaker and therefore the influence of the experiment parameters are much more sensitive. If you are off the right setting by quite a lot, you will not obtain a clear spectrum. And due to the constant self-evolvement of the old setup, which was build, with all likelihood, decades ago, it is really tough to repeat one beautiful right away.
After a long fight with the experiment setup and plenty of praying, we finally could measure a very nice spectrum of ZnS, how it is supposed to be:
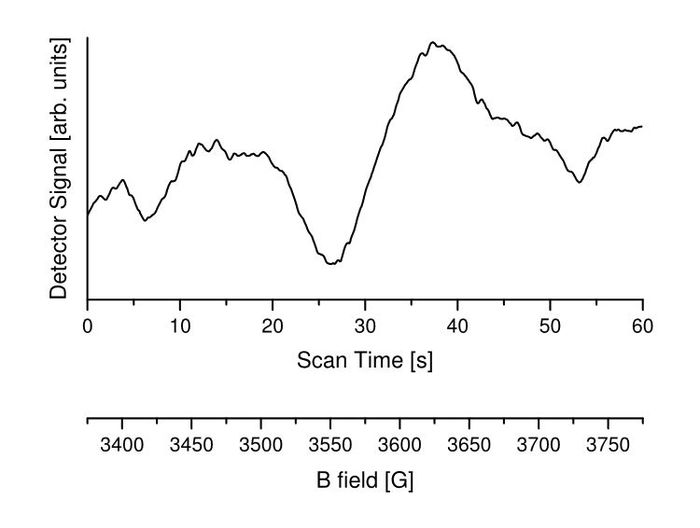
The ZnS spectrum was recorded not with the laptop oscilloscope, but with a normal external oscilloscope, which facilitate data export onto a flash drive. With the run on the laptop oscilloscope we noticed a high constant voltage intercept, which prevented us from zooming in deep enough by changing the volts per division. At one point the curve was simply off range. We utilized the original main console for this material, too. The scan values were
- Frequency (exterior wavecounter): n.a.
- Attenuation: 16 dB
- Iris (rotation from closed completely): 3.5
- B field start: 3375 G
- B field delta: 400 G
- Scan time: 1 min
- Signal filter: position 10
- Modulation amplitude: 40 G
- Gain: 320
By the way, technically ZnS should also have a so called side bands on both sides next to the main ESR peak. It can be the case that we can see them in the diagram above at about 3440 G and 3740 G. It is simply not possible to verify that they are symmetrically distributed aside from the main wiggle, the graph is not clear enough. It is worth to spend some time on this later on, tough.
ZnS (Sample #9)
After numerous measurements of ZnS sample #8 we regognized that there is a little part of scotch take on it. And since we had another tube indicating that it contains the material ZnS, we tried to verify it with sample #9. At this point we already bypassed the old internal Lock-In by an exterior one. Therefore it was a test of that part at the same time.
Again, this sample it tough to deal with, because the resonance is quite weak and the manners of the old main console:
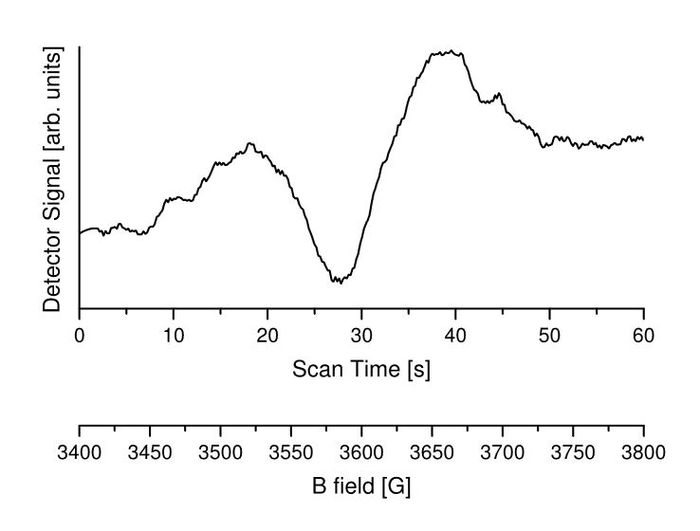
As alreday mentioned above, this time we used the external Lock-In, but displayed the signal on the external oscilloscope, which we utilized for storing data as well. The scan values were
- Frequency (exterior wavecounter): 9,23216 GHz
- Attenuation: 16 dB
- Iris (rotation from closed completely): 3.75
- B field start: 3400 G
- B field delta: 400 G
- Scan time: 1 min
- Signal filter: bypassed
- Gain: bypassed
- Modulation amplitude: 40 G
- Lock-In - Sensitivity: 10 mV
- Lock-In - Time constant: 1 s
- Lock-In - AC Gain: 10 dB
Be aware of the somewhat different B-field axis: It is shifted by 25 G. Given that and a normal error both graphs are identical, regarding the main wiggle. Although, we did not reveal the two side dips, which seemed fairly consistent for the previous sample.
Desired and future ESR setup
Unreliability of the old setup
Basically, the only part, which work perfectly are magnets, both the big and powerful DC's and the small AC's, the klystron for the microwaves, the attenuator as well as the detector. At least so far there was not a simple moment were we experienced something to pass out or anything else, not as the main console, which freaks out once in a while. Because of that happens more and more often, the urgent task is to understand what essential control signals are sent to the magnet bridge. We encountered various strange moments from a spontaneous tremendous magnetic field offset, which mysteriously was gone after minutes, to a complete strike, where a scan could not be started any more. Those incidents certainly affected the magnet bridge, too. This part did not response any more or was weird in another way. Essentially every time such an occurrence happened, it was definitely not due to an operator, came just out of the blue. Hence, we could not determine the reason, all attempts to distinguish the origin were a dead end. The sole solution that worked as shutting down all the devices and wait. The time after the machine surprisingly decided to function again was completely random. I can be just the fact to be power off and turned on again, however, also half an hour.
Schematic composition of the new setup
The future plan with the whole project is to replace as many old modules as fast as possible, preferably, all of the controlling parts, likely step by step. In consequence of the reasons above, preferably, we want to control each step in the data processing as well as in the magnet circuitry by external and much newer machines. The precision and resolution of essentially any modern device is better than the internally installed into the main control panel of decades ago. There following schematic displays the essential basic parts of ESR:
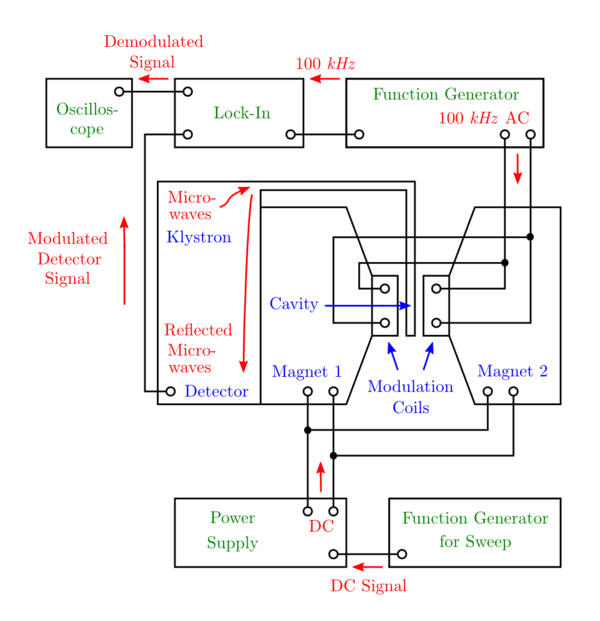
The blue devices are the ones that are kept from the original machine, although some of them are now regulated by exterior equipment. The green devices are the mentioned external controllers. The red arrows correspond to the communication between all the various devices.
Most of it should be performed pretty easily, however, the alignment such that all the numerous parts function together properly and do not irritate one another can be quite a challenge. At this point there is basically only one thing that prevents fast progress on the hardware section. The klystron or maybe even the entire magnet bridge does not respond to operating it without turning on the main console. Perhaps there is some essential communication among the two big experimental machines, which enables the klystron and the detector, respectively. Once that is resolved and there is an idea how to manipulate that or provide it externally, there should nothing be in the way to build the ESR setup like in the diagram.

