Electron Spin Resonance: Difference between revisions
| Line 76: | Line 76: | ||
==Operating instructions== | ==Operating instructions== | ||
. | Operating the ESR setup is relativly simple, as long as you obey the following steps. However, there are some essential things to do and a few things not to do, respectively. Comply with this guidelines: | ||
===Starting the machine=== | |||
. | # Turn on the water cooling system to a decent flow rate. It is not neceassry open the outlet lever entirely. In fact, that will cause quite a high pressure in the supply hose. Perhaps, that lead to subtle damage. Moreover, longruns have shown that the outflow does not get warmer at all, even after hours at a quite high magnetic field strength. | ||
# Check else is shut down: | |||
## Switch at the back of the magnet bridge, which hosts the klystron and the detector. | |||
## Mode switch on the front panel is set to standby. | |||
## Magnetic field set value is zero. | |||
# Enable power switch on the lower left corner of the main console. | |||
# Clean your sample and place it inside the tube, made for holding the sample between the two magnet poles. | |||
# Change mode first to turn and then to operate. Wait for a while (up to one minute). Dial the frequency once in a while and see whether the two scales AFC output and detector current respond. When they react to changes, set the AFC to zero. The frequency of the klystron equates the resonance frequency of the cavitiy now. | |||
# Adjust the Iris height by srewing the stick in or rather out. The aim is to minimize the detector current which correspond to the total power of reflected microwaves (The past has shown that the height ranges at approximately 3-4 rotations from closed entirely). | |||
# Align the height of the sample inside the tube. The sample is sitting in the center of cavity and hence has an effect on the resonance frequency of the cavity. For the measurement later on, it is very desirable to reduce it to a minimum. The sample pipe is put into the holder tube by a little ring, which prevents it from falling into the tube. Carefully change the position of the ring and always put the sample pipe back and see where the AFC stops. You want the AFC to be as left as possible. This step is really sensitive. Normally the AFC changes just by pulling the sample pipe out and inserting it back, without sliding the ring. Even rotating the sample interacts with the AFC, especially when the material is not distributed uniformly at the very bottom of the pipe. That is the case for materials other than liquids and powders, for instance little solid plates. | |||
# Check the Iris again (optional) | |||
# Chose a value for Gain, Modulation Amplitude, Signal Filter, Scan Time. | |||
# Set the magnetic field start value and the sweep interval. | |||
# Press the start knob on the horizontal board of the main console, right to the old data plotting mechanism. | |||
===Changing sample=== | |||
# You may shut down the magnetic field first. | |||
# Switch the mode from operate to tune (on the magnet bridge). | |||
# Replace the sample. Do not forget to clean it. | |||
# Repeat steps 5 to 11 of the list above. | |||
===Shutting down=== | |||
# Power off the magnetic field. | |||
# Switch the mode from operate to tune (on the magnet bridge). Afterwards spin the know even more to standby mode. | |||
# Take your sample out of the cavity and store or shelf it. | |||
# Disable magnet bridge by switch at the back. | |||
# Press main power switch on the main control panel. | |||
# Close water supply. | |||
==ESR measurements== | ==ESR measurements== | ||
Revision as of 08:58, 23 November 2014
Electron Spin Resonance (ESR) is a phenomenon, usefull for the investigation of materials which contain unpaired spins. Those are caused by various sources. One are not completely filled atomic shells, however, the more interesting ESR signals arise from different circumstances combined in the term defect. For instance, a important one is impurities of semiconductors or isolators which can trap electron or holes. Therefore this measuring technique is very powerfull evaluation of material properties and is used in lots of research fields in physics, chemistry and biology.
Physical background

As the term Electron Spin Resonance already implies, the most essential part of the entire topic is the Spin, an intrinsic angular momentum of the electron. In an atom most of the electron are paired regarding spin. That is, each electron has a partner with an opposite spin, creating a zero net spin. Depending on the electron configuration of an atom or one step above in molecules and solids respectively, it is possible that there are a few or even many single electrons, being up to material.
Generally the magnetic moment of an electron is given by
Failed to parse (SVG (MathML can be enabled via browser plugin): Invalid response ("Math extension cannot connect to Restbase.") from server "https://wikimedia.org/api/rest_v1/":): {\displaystyle \vec{\mu}=-\mu_B\left(\vec{L}+g_e\,\vec{S}\right) } ,
where Failed to parse (SVG (MathML can be enabled via browser plugin): Invalid response ("Math extension cannot connect to Restbase.") from server "https://wikimedia.org/api/rest_v1/":): {\displaystyle \mu_B } is the Bohr's magneton and Failed to parse (SVG (MathML can be enabled via browser plugin): Invalid response ("Math extension cannot connect to Restbase.") from server "https://wikimedia.org/api/rest_v1/":): {\displaystyle g_e } the magnetogyric ratio, for a free electron it is Failed to parse (SVG (MathML can be enabled via browser plugin): Invalid response ("Math extension cannot connect to Restbase.") from server "https://wikimedia.org/api/rest_v1/":): {\displaystyle g_e=2.0023\approx 2 } . This quantity is a measure for the quantitive relation of an angular momentum and its corresponding magnetic momentum. The latter formula includes the orbital angular momentum as well. With ESR it is only possible to detect and investigate the spin component of the total magnetic moment. Hence, in the further deviation we will look at the pure magnetic moment originating from the spin Failed to parse (SVG (MathML can be enabled via browser plugin): Invalid response ("Math extension cannot connect to Restbase.") from server "https://wikimedia.org/api/rest_v1/":): {\displaystyle \vec{S} } .
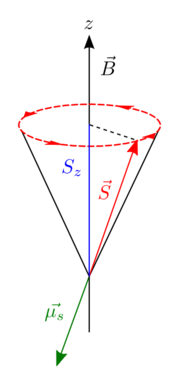
If the spin Failed to parse (SVG (MathML can be enabled via browser plugin): Invalid response ("Math extension cannot connect to Restbase.") from server "https://wikimedia.org/api/rest_v1/":): {\displaystyle \vec{S} } and its magnetic moment Failed to parse (SVG (MathML can be enabled via browser plugin): Invalid response ("Math extension cannot connect to Restbase.") from server "https://wikimedia.org/api/rest_v1/":): {\displaystyle \vec{\mu_S} } is placed in a externally applied magnetic field, the magnetic moment of the spin starts to precess around the axis of the magnetic field due to the torque
Failed to parse (SVG (MathML can be enabled via browser plugin): Invalid response ("Math extension cannot connect to Restbase.") from server "https://wikimedia.org/api/rest_v1/":): {\displaystyle \vec{M}=\vec{\mu_S}\times\vec{B_Z} } .
As always in Quantum Physics the chosen axis of the magnetic field points in Failed to parse (SVG (MathML can be enabled via browser plugin): Invalid response ("Math extension cannot connect to Restbase.") from server "https://wikimedia.org/api/rest_v1/":): {\displaystyle z } direction.

In generell, the energy Failed to parse (SVG (MathML can be enabled via browser plugin): Invalid response ("Math extension cannot connect to Restbase.") from server "https://wikimedia.org/api/rest_v1/":): {\displaystyle E } of a magnetic moment Failed to parse (SVG (MathML can be enabled via browser plugin): Invalid response ("Math extension cannot connect to Restbase.") from server "https://wikimedia.org/api/rest_v1/":): {\displaystyle \vec{\mu} } is defined as
Failed to parse (SVG (MathML can be enabled via browser plugin): Invalid response ("Math extension cannot connect to Restbase.") from server "https://wikimedia.org/api/rest_v1/":): {\displaystyle E=-\vec{\mu}\cdot\vec{B_Z} } .
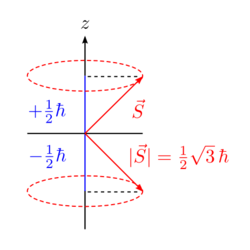
The magnetic moment Failed to parse (SVG (MathML can be enabled via browser plugin): Invalid response ("Math extension cannot connect to Restbase.") from server "https://wikimedia.org/api/rest_v1/":): {\displaystyle \vec{\mu} } is related to the spin Failed to parse (SVG (MathML can be enabled via browser plugin): Invalid response ("Math extension cannot connect to Restbase.") from server "https://wikimedia.org/api/rest_v1/":): {\displaystyle \vec{S} } , which is a so called Quantum Vector with special properties:
- Absolute value: Failed to parse (SVG (MathML can be enabled via browser plugin): Invalid response ("Math extension cannot connect to Restbase.") from server "https://wikimedia.org/api/rest_v1/":): {\displaystyle |S|=\sqrt{s\left(s+1\right)} }
- Projection onto the z-axis: Failed to parse (SVG (MathML can be enabled via browser plugin): Invalid response ("Math extension cannot connect to Restbase.") from server "https://wikimedia.org/api/rest_v1/":): {\displaystyle m_S=\pm\frac{\hbar}{2} }
Incedentally, those two quantities are the best way to distinguish the state of the electron, because only their operator commute and hence, are mesasurable at the same time. For instance, it is not possible to measure two of the three cartesian components of the spin vector simultaneously.

The equation for the energy of the electron's spin in an applied magnetic field contains a dot product between the magnetic moment and the B-field:
Failed to parse (SVG (MathML can be enabled via browser plugin): Invalid response ("Math extension cannot connect to Restbase.") from server "https://wikimedia.org/api/rest_v1/":): {\displaystyle E=\mu_B\,g_e\,\vec{S}\cdot\vec{B_Z} }
It may seem to complicate the situation, but acutally it simplifies it a lot. We have chosen our magnetic field to point into the Failed to parse (SVG (MathML can be enabled via browser plugin): Invalid response ("Math extension cannot connect to Restbase.") from server "https://wikimedia.org/api/rest_v1/":): {\displaystyle z } direction. Since the spin is characterized by the projection onto the Failed to parse (SVG (MathML can be enabled via browser plugin): Invalid response ("Math extension cannot connect to Restbase.") from server "https://wikimedia.org/api/rest_v1/":): {\displaystyle z } axis, depicted by the Quantum number Failed to parse (SVG (MathML can be enabled via browser plugin): Invalid response ("Math extension cannot connect to Restbase.") from server "https://wikimedia.org/api/rest_v1/":): {\displaystyle m_S } , the dot product cancels to
Failed to parse (SVG (MathML can be enabled via browser plugin): Invalid response ("Math extension cannot connect to Restbase.") from server "https://wikimedia.org/api/rest_v1/":): {\displaystyle E=\mu_B\,g_e\,m_S\,B_Z }
with
Failed to parse (SVG (MathML can be enabled via browser plugin): Invalid response ("Math extension cannot connect to Restbase.") from server "https://wikimedia.org/api/rest_v1/":): {\displaystyle m_S=\pm\frac{\hbar}{2} } .
Bohr's magneton Failed to parse (SVG (MathML can be enabled via browser plugin): Invalid response ("Math extension cannot connect to Restbase.") from server "https://wikimedia.org/api/rest_v1/":): {\displaystyle \mu_B } and the magnetogyric ratio Failed to parse (SVG (MathML can be enabled via browser plugin): Invalid response ("Math extension cannot connect to Restbase.") from server "https://wikimedia.org/api/rest_v1/":): {\displaystyle g_e } are both natural constants at this point. If a external magnetic field Failed to parse (SVG (MathML can be enabled via browser plugin): Invalid response ("Math extension cannot connect to Restbase.") from server "https://wikimedia.org/api/rest_v1/":): {\displaystyle B_Z } is applied (positive value, because we picked the Failed to parse (SVG (MathML can be enabled via browser plugin): Invalid response ("Math extension cannot connect to Restbase.") from server "https://wikimedia.org/api/rest_v1/":): {\displaystyle z } orientation of our coordinate system in such a way), the electron's energy is reduced or raised, depending whether Failed to parse (SVG (MathML can be enabled via browser plugin): Invalid response ("Math extension cannot connect to Restbase.") from server "https://wikimedia.org/api/rest_v1/":): {\displaystyle m_S } is negative or positive, respectively. The original single energy state, which we still get out of the equation for Failed to parse (SVG (MathML can be enabled via browser plugin): Invalid response ("Math extension cannot connect to Restbase.") from server "https://wikimedia.org/api/rest_v1/":): {\displaystyle B_Z=0 } , is split into two different energy states. Moreover, the energy difference
Failed to parse (SVG (MathML can be enabled via browser plugin): Invalid response ("Math extension cannot connect to Restbase.") from server "https://wikimedia.org/api/rest_v1/":): {\displaystyle \Delta E=E_{+1/2}-E_{-1/2}=+\frac{1}{2}\,\mu_B\,g_e\,B_Z-(-\frac{1}{2}\,\mu_B\,g_e\,B_Z)=\mu_B\,g_e\,B_Z}
is proportional to the strength of the applied magnetic field. Therefore that difference can be tuned very precisely by the experimental setup, which is very important for the latter detection of the ESR signal.
For typical laboratory B-fields the energy difference Failed to parse (SVG (MathML can be enabled via browser plugin): Invalid response ("Math extension cannot connect to Restbase.") from server "https://wikimedia.org/api/rest_v1/":): {\displaystyle \Delta E } ranges in the microwave photon band, if you convert the energy to wavelength or rather frequency. This is the point, where the name of the entire phenomenon originates. Namely, if one irradiates the unpaired spin, which normally sits in the lower energy state (due to general energy minimization of nature), with the correct frequency, the energy gets absorbed, combined with a transition to the upper level. In this case, the energy of the photons match exactly the energy difference between both states. Physicist call this situation Electron Spin Resonance.
In formula language the following becomes true:
Failed to parse (SVG (MathML can be enabled via browser plugin): Invalid response ("Math extension cannot connect to Restbase.") from server "https://wikimedia.org/api/rest_v1/":): {\displaystyle h\,\nu=\mu_B\,g_e\,B_Z } ,
where Failed to parse (SVG (MathML can be enabled via browser plugin): Invalid response ("Math extension cannot connect to Restbase.") from server "https://wikimedia.org/api/rest_v1/":): {\displaystyle h } is Planck's constant and Failed to parse (SVG (MathML can be enabled via browser plugin): Invalid response ("Math extension cannot connect to Restbase.") from server "https://wikimedia.org/api/rest_v1/":): {\displaystyle \nu } the frequency of the incident light.
Other than the magnetogyric ratio Failed to parse (SVG (MathML can be enabled via browser plugin): Invalid response ("Math extension cannot connect to Restbase.") from server "https://wikimedia.org/api/rest_v1/":): {\displaystyle g_e } are all quantities either natural constants or measured values. Above I claimed that this value is a natural constant, too. Well, technically it is one, however, depends on the material and its compounds and especially spin stucture. Taking the previous equation as well as transferring it to an expression for the magnetogyric ratio
Failed to parse (SVG (MathML can be enabled via browser plugin): Invalid response ("Math extension cannot connect to Restbase.") from server "https://wikimedia.org/api/rest_v1/":): {\displaystyle g_e=\frac{h\,\nu}{\mu_B\,B_Z} }
yields material properties with regard to the spin configuration. For example, the comparison to the definite value of a free electron is an good indicator for various substances' features.
Experimental setup
.
.
.
Operating instructions
Operating the ESR setup is relativly simple, as long as you obey the following steps. However, there are some essential things to do and a few things not to do, respectively. Comply with this guidelines:
Starting the machine
- Turn on the water cooling system to a decent flow rate. It is not neceassry open the outlet lever entirely. In fact, that will cause quite a high pressure in the supply hose. Perhaps, that lead to subtle damage. Moreover, longruns have shown that the outflow does not get warmer at all, even after hours at a quite high magnetic field strength.
- Check else is shut down:
- Switch at the back of the magnet bridge, which hosts the klystron and the detector.
- Mode switch on the front panel is set to standby.
- Magnetic field set value is zero.
- Enable power switch on the lower left corner of the main console.
- Clean your sample and place it inside the tube, made for holding the sample between the two magnet poles.
- Change mode first to turn and then to operate. Wait for a while (up to one minute). Dial the frequency once in a while and see whether the two scales AFC output and detector current respond. When they react to changes, set the AFC to zero. The frequency of the klystron equates the resonance frequency of the cavitiy now.
- Adjust the Iris height by srewing the stick in or rather out. The aim is to minimize the detector current which correspond to the total power of reflected microwaves (The past has shown that the height ranges at approximately 3-4 rotations from closed entirely).
- Align the height of the sample inside the tube. The sample is sitting in the center of cavity and hence has an effect on the resonance frequency of the cavity. For the measurement later on, it is very desirable to reduce it to a minimum. The sample pipe is put into the holder tube by a little ring, which prevents it from falling into the tube. Carefully change the position of the ring and always put the sample pipe back and see where the AFC stops. You want the AFC to be as left as possible. This step is really sensitive. Normally the AFC changes just by pulling the sample pipe out and inserting it back, without sliding the ring. Even rotating the sample interacts with the AFC, especially when the material is not distributed uniformly at the very bottom of the pipe. That is the case for materials other than liquids and powders, for instance little solid plates.
- Check the Iris again (optional)
- Chose a value for Gain, Modulation Amplitude, Signal Filter, Scan Time.
- Set the magnetic field start value and the sweep interval.
- Press the start knob on the horizontal board of the main console, right to the old data plotting mechanism.
Changing sample
- You may shut down the magnetic field first.
- Switch the mode from operate to tune (on the magnet bridge).
- Replace the sample. Do not forget to clean it.
- Repeat steps 5 to 11 of the list above.
Shutting down
- Power off the magnetic field.
- Switch the mode from operate to tune (on the magnet bridge). Afterwards spin the know even more to standby mode.
- Take your sample out of the cavity and store or shelf it.
- Disable magnet bridge by switch at the back.
- Press main power switch on the main control panel.
- Close water supply.
ESR measurements
We have a bunch of samples, which are supposed to be responsive to ESR. Unfortunatly none of them, except two, are labeled or named. In the entire process of working on this project we tested numerous samples of this set. Most of them did not show any signal within the whole magnetic field scan range, however, at this point our skills on at which dial to chose which value was really limited. We tried to tune and optimize the quantities though, and dedicated quite a lot of time to consistency and the attempt to repeat ESR spectra with different materials.
DPPH
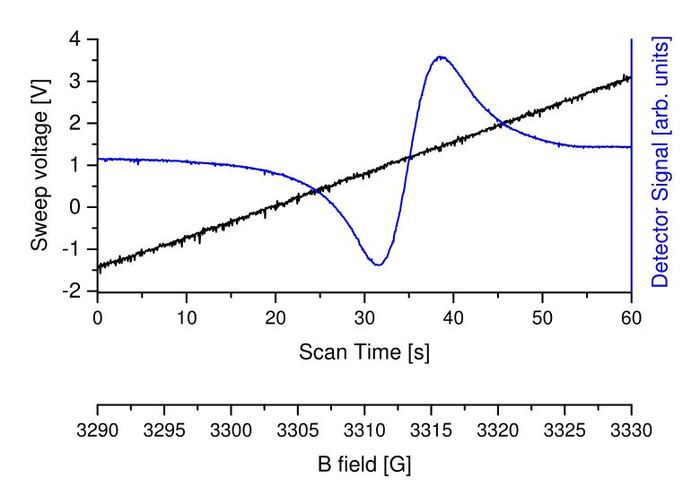
The strongest signal shows DPPH, the organic chemical compound 2,2-diphenyl-1-picrylhydrazyl. The absorbance of the indicent microwave irradiation is really strong, such that the various parameters of the entire experiment loose their importance. As long as reasonable values for the numerous setting are chosen, one can find the strength of the magnetic field, where the dip in the by the cavity reflected power occurs - even when the magnetic field gets scanned kind of fast. Therefore, it's the perfect sample for the beginning and for ESR learners, because you receive a response for regulations far off the optimum. Moreover, always when something is changed at the experimental setup and it seems that it does not work appropriatly any more, it is the sample to varify any issues, misalignment and damage.
One of our nicest DPPH spectrum is shown below. The figure depicts the linear sweep of the magnetic field strength as well, related to the sweep voltage:

This spectrum is taken with the original main console as central controlling panel (future plans are to bypass this entire part) and the digital oscilloscope on the laptop, using the data aquisition board from Measurement Computing. The concrete set values were
- Frequency (exterior wavecounter): 9.2437 GHz
- Attenuation: 20 dB
- Iris (rotation from closed completely): 3.75
- B field start: 3290 G
- B field delta: 40 G
- Scan time: 1 min
- Signal filger: position 7
- Modulation amplitude: 4
- Gain: 1000
Incidently, the sweep voltage is very important to find the acutal start and end point of the sweep at this stage, because it is directly coupled to the mechanical sweep mechanism. One can use the trigger, but there is still a delay between the impulse and the real start of cycle.
ZnS
In fact this sample not only contains inorganic ZnS (zinc sulfide), but it form a layer on a Silicon wafer. Since Silicon forms a perfect lattice, in theory, all that is observed ESR respond should originate from the ZnS coat. Though, everybody knows that practically there are no perfect crystalls in nature. Hence, it is possible that signals arise as well from impurities in the Silicon lattice.
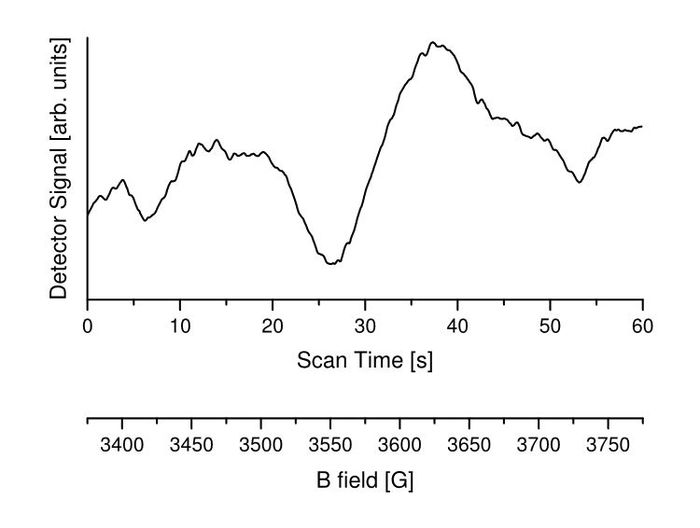
In fact, the exact magnetic field strength of this sample, we found by first looking up, where it should appear approximately. It is much weaker and therefore the influence of the experiment parameters are much more sensitive. If you are off the right setting by quite a lot, you will not obtain a clear spectrum. And due to the constant self-evolvement of the old setup, which was build, with all liklyhood, decads ago, it is really tough to repeat one beautiful right away.
After a long fight with the experiment setup and plenty of praying, we finally could measure a very nice spectrum of ZnS, how it is supposed to be:

The ZnS spectrum was recorded not with the labtop oscilloscope, but with a normal external oscilloscope, which facilitate data export onto a flash drive. With the run on the laptop oscilloscope we noticed a high constant voltage intercept, which prevented us from zooming in deep enough by changing the volts per division. At one point the curve was simply off range. We utilized the original main console for this material, too. The scan values were
- Frequency (exterior wavecounter): n.a.
- Attenuation: 16 dB
- Iris (rotation from closed completely): 3.5
- B field start: 3375 G
- B field delta: 400 G
- Scan time: 1 min
- Signal filger: position 10
- Modulation amplitude: 4
- Gain: 320
By the way, technically ZnS should also have a so called side bands on both sides next to the main ESR peak. It can be the case that we can see them in the diagramm above at about 3440 G and 3740 G. It is simply not possible to varify that they are symetrically distributed aside from the main wiggle, the graph is not clear enough. It is worth to spend some time on this later on, tough.
Desired and future ESR setup
.
.
.